Autographic Visualization (IEEE VIS Paper)

Autographic Visualization (IEEE VIS Paper)

Autographic Visualization (IEEE VIS Paper)

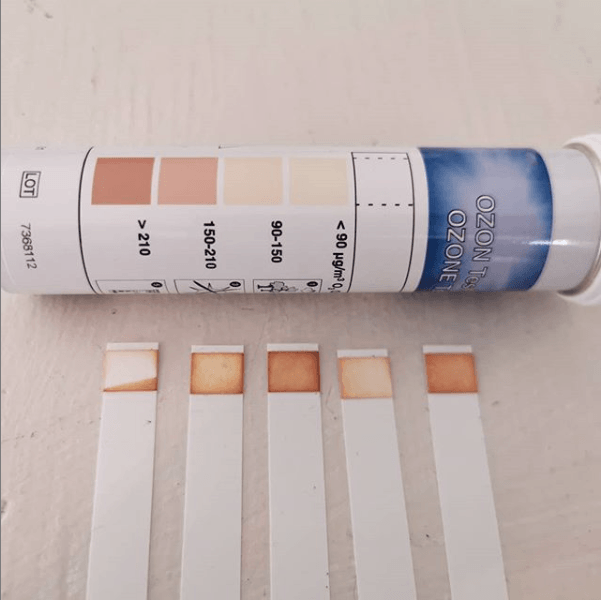
Data by Proxy — Material Traces as Autographic Visualizations

Per definition, data visualization can only begin when data exists. As a result, the process of data collection remains mostly hidden. Visualization methods are designed to reveal patterns in data; however, many public controversies are not about what is “in” the data, but about the circumstances of data collection.

Autographic visualization is a speculative counter-model to data visualization based on the premise that data are something material rather than something abstract and symbolic. The design operations of autographic visualization aim to set the conditions that allow material phenomena to reveal themselves — as physical traces or environmental indicators. The design of autographic or self-registering devices has a long history that is closely connected to the history of data visualization. Today, autographic visualization can be used to make the process of data collection more legible and accountable. The comparison between the two models allows probing the epistemic assumptions behind information visualization and uncovers linkages with the rich history of scientific visualization and trace reading.

link to IEEE VIS paper
VISAP pictorial

Ozone Tattoo

Ozone Tattoo

Ozone Tattoo

Partners: Dr. Vehram Elagoz, Lesley University, Dr. Kent Burkey, USDA ARS Maryland

Among other issues, climate change leads to an increase in ground-level ozone, a pollutant with harmful impacts on plants, animals, and humans. Ozone tattoo is an autographic visualization project that uses ozone-sensitive plants as bio-indicators to visualize ozone pollution. Ozone tattoos are damage patterns on the surface of the leaves created by localized exposure to ozone. These damage patterns allow decoding the impact of the pollutant through visual comparison with the healthy portions of the leaf.

The project is based on the established citizen science approach of planting ozone gardens, which allow communities to monitor pollution by observing plants that are sensitive to ozone. One of the indicator plants used in the project, the tobacco plant, has historical significance for Massachusetts and its history of industrialization. Until the early 1920s, western Massachusetts was a center of tobacco production, the source of high-quality cigar wrappers. One factor that ended this thriving industry was the adverse effect of ground-level ozone resulting from industrialization. Tobacco plants are highly sensitive to ozone and show visible damage already at low concentrations. This sensitivity makes the plants an excellent bio-indicator that is often used in ozone garden projects.

Exhibition at the Cambridge Council of the Arts

A Flitting Atlas of the Human Gaze

A Flitting Atlas of the Human Gaze

A Flitting Atlas of the Human Gaze

When the Harvard Art Museums collection looks back at us, which direction does it look? Up, down, left, or right? How deeply or shallowly does it cast its gaze? Do most images peer straight into the visitor’s eyes? What is the orientation of the subject’s head, frontal or rotated? Do particular media or cultural traditions correlate with preferences regarding the directionality of the human gaze? The installation is built upon the AI-based extraction and analysis, fine-tuned via human supervision, of pairs of eyes from the Harvard Art Museum painting, print, sculpture, and coin collections. It allows the visitor, equipped with an input device, to explore the collections from the standpoint of the depicted subject’s gaze direction. A red dot appears where the input device is pointed towards the wall of monitors, establishing a focal point, a point of convergence around which arrays of images are summoned. For centuries visitors have navigated collections on the basis of culture, chronology, genre, and medium; to those conventional forms of exploration, A Flitting Atlas of the Human Gaze adds a new mode based on the distribution of looks across media and time.

A collaboration between Kevin Brewster, Todd Linkner, Dietmar Offenhuber, Jeffrey Schnapp (in alphabetical order)

Link to the webversion of the project