Urban Radiance

Urban Radiance

Urban Radiance

A visual companion for the essay “Sticky data – context and friction in the use of urban data proxies.” published in Data and the City. ed. Rob Kitchin, Tracey P. Lauriault, and Gavin McArdlel. New York: Routledge. [pdf]

What have global data sets that estimate population density, economic productivity, measles outbreaks, rural poverty, resource footprints and electrification rates, urbanization and suburbanization, or average wages in common? They are all based on nighttime imagery of city lights captured by the Operational Line Scanner (OLS) sensor on the satellites from the US Defense Meteorological Satellite Program (DMSP).

What should later become the workhorse of geographers and economists was initially a completely accidental by-product: of a cold-war era military satellite program—launched in the 1950s by the US Air Force for estimating cloud cover and precipitation for reconnaissance missions. Army engineers discovered that the sensors were sensitive enough to capture the artificial radiance of cities during moonless nights without cloud cover.

In 1978, Thomas A. Croft published the first global composite of night-time images in the Scientific American. At that time, the image data had to be manually stitched together from analog films ejected in capsules from the satellite, which had to be laboriously recovered by the military. Today, the Black Marble data set has become one of the most popular motifs of space imagery.

While DPMS images are usually used to show regional differences, this project visualizes the temporal change in urban radiance from 1992 until 2015. It is the first interactive visualization of radiance time series data.

Link to project

Indexical Design Conference

Indexical Design Conference

Indexical Design Conference

Symposium curated at Northeastern University.

Indexical Design addresses the difference between data and evidence. The symposium explores the physical trace and its role for making sense of the world. We will investigate the different scientific, aesthetic, and rhetoric techniques for making traces “speak.”

Information visualization is traditionally concerned with the symbolic languages of charts, maps, and diagrams. Its underlying data are also symbolic representations: the results of processes encoding traces and events. At the same time, traces such as tree rings, fingerprints, or ice core samples are also visualizations that we can directly experience.

Traces, like data, are often assumed as being “given,” but again, like data, they are revealed through measurement. How we perceive traces is a result of how we frame them. The symposium proposes “Indexical Design” as a new paradigm for data visualization that is specifically relevant for fields that deal with traces, markers, and indices; fields such as microbiology, forensics, or citizen science. We will bring together experts from these and other fields to investigate the physical manifestations of information and discuss the role of design in framing how these traces speak to us.

Slides from my opening remarks

Graphic design: Pedro Cruz, Tom Starr

Organization
Dep. Art+Design: Judy Ulman, Zohreh Firouzabadian, Chris Franson, Alison Kelly, Doug Scott, Ann McDonald, Kristian Kloeckl, Tom Starr, Nathan Felde
Northeastern Center for the Arts: Bree Edwards, Tom Vannatter, Terri Evans, Daniel Lim
Student volunteers: Aldo Viramontes, Armin Akhavan, Lia Petronio, Navarjun Grewal, Ryan Morrill, Andrew Tang, Kim McDevitt, Jinni Luo, Irene De La Torre, Jessie Richards, Maaria Assami
Special thanks to Mary Sherman

With generous support by
Goethe Institute: Christoph Mücher, Annette Klein
Swissnex: Cecile Vulliemin, Arthur Emery

Photo May 27, 3 47 43 PM

Conference program with built-in Cyanometer, a device for measuring the blueness of the sky. Designed by Pedro Cruz and Tom Starr

Cryptographic Heritage 

Cryptographic Heritage 

Cryptographic Heritage 

The number on the lower edge is the public bitcoin address, which is connected to an unique, publicly accessible, but immutable entry in the Bitcoin blockchain. Design: Azra Aksamija

The following text is paraphrased from a recent medium article on the subject:

The cryptographic heritage project, led by Dietmar Offenhuber, explores best practices how to use Bitcoin and blockchain technology to store evidence of cultural heritage under threat in ethnic and nationalistic conflicts.

To give an example — in nationalistic conflicts, cultural heritage such as libraries, religious buildings, or historic monuments are the first things targeted for destruction. This is because they bear testimony of a multicultural past, as Aksamija has demonstrated in her analysis of the Balkan wars of the 90s. These efforts included denial that a particular community has been living in an area before ethnic cleansing — to the extent that buildings are erased not only from the city, but also from old postcards and archival material. Needless to say, this also has implications for ownership of land and houses of the displaced.

UNESCO and other entities tried to address this by capturing immaterial cultural heritage through databases and websites. The problem is that these websites are just as vulnerable as the practices and buildings they are supposed to document.

Here is where Bitcoin comes into the picture. All Bitcoin transactions are documented in a decentralized database called the blockchain, which exits in thousands of copies across the world. The blockchain can be publicly read, but its contents cannot not deleted or manipulated – as ensured by strong cryptography. The blockchain can be appended by everyone through making a transaction.

Every transaction can hold a small amount of additional information, 80 bytes to be precise. Together with the cryptographic proof that the transaction has been authorized by a specific address at a specific time, this additional message constitutes evidence.

This can be taken advantage of in many ways: Residents could publicly declare “this is my house” and provide evidence that nobody can hide or delete after displacement and ethnic cleansing. They could also use the blockchain to prove that a particular document (e.g. a property title) existed in a specific form at a specific time, and to produce evidence whether this document has been manipulated in the meantime.

Furthermore, the author of the transaction can also prove his identity, by cryptographically signing a messages associated with the transaction. In this regard, Bitcoin offers accessible and versatile cryptographic tools  beyond financial transactions.

The process of encoding cultural information into monetary transactions may seem foreign, but has a clear equivalent in the world of physical money, for example when a contract is made official by the symbolic transaction of one dollar.

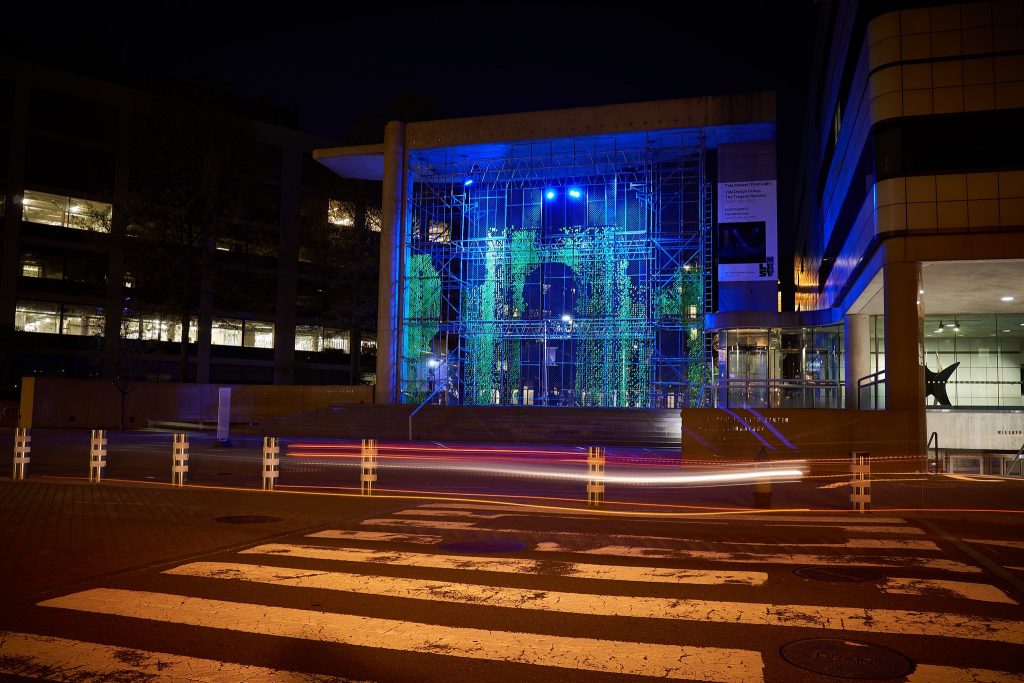
The idea of cryptographic heritage is at the moment tested in Azra Aksamija’s Memory Matrix project, which recreates destroyed heritage on MIT campus in a participatory project. Individual plexiglass jewelry, arranged as pixels to form the destroyed arch of Palmyra, are inscribed with the cultural memory of individual participants, and are also encoded with a message in the blockchain that only the original author has control over.The owner of a pixel can prove ownership of the jewelry through the associated private key, can use the key to sign and authenticate messages. Also the public can use the public key to encrypt messages that only the owner can decode. Victims of ethnic cleansing often keep the keys to the front door of their former home from which they were expelled as a memento. See the recent documentary project by photographer Bradley Secker. With cryptographic heritage, the key is no longer a symbolic item, it can store value, prove ownership, transmit messages, and leave a mark and testimony in the world.

Azra Aksamija’s Memory Matrix project installed at the MIT Medialab building.