What do New Yorkers complain about?

What do New Yorkers complain about?

What do New Yorkers complain about?

Currently I am working on a comparative study of the design factors of citizen feedback systems based on the data they generate. The recent history of these systems is a tale of growing ambition. In the past decade, most large US cities have implemented non-emergency incident reporting systems via telephone helplines, websites, and recently mobile applications. During that time, 311 systems, named after the three-digit telephone number reserved for that purpose, have evolved from service hotlines to public accountability instruments, data sources for urban maintenance and tools for civic engagement.

A small visualization of the New York 311 data that I did past September, keeps surfacing on different blogs. The city of NY publishes all community requests; around 2 Million for the past two years, covering over 100 types of incidents ranging from code violations on construction sites to plumbing issues in public housing projects.
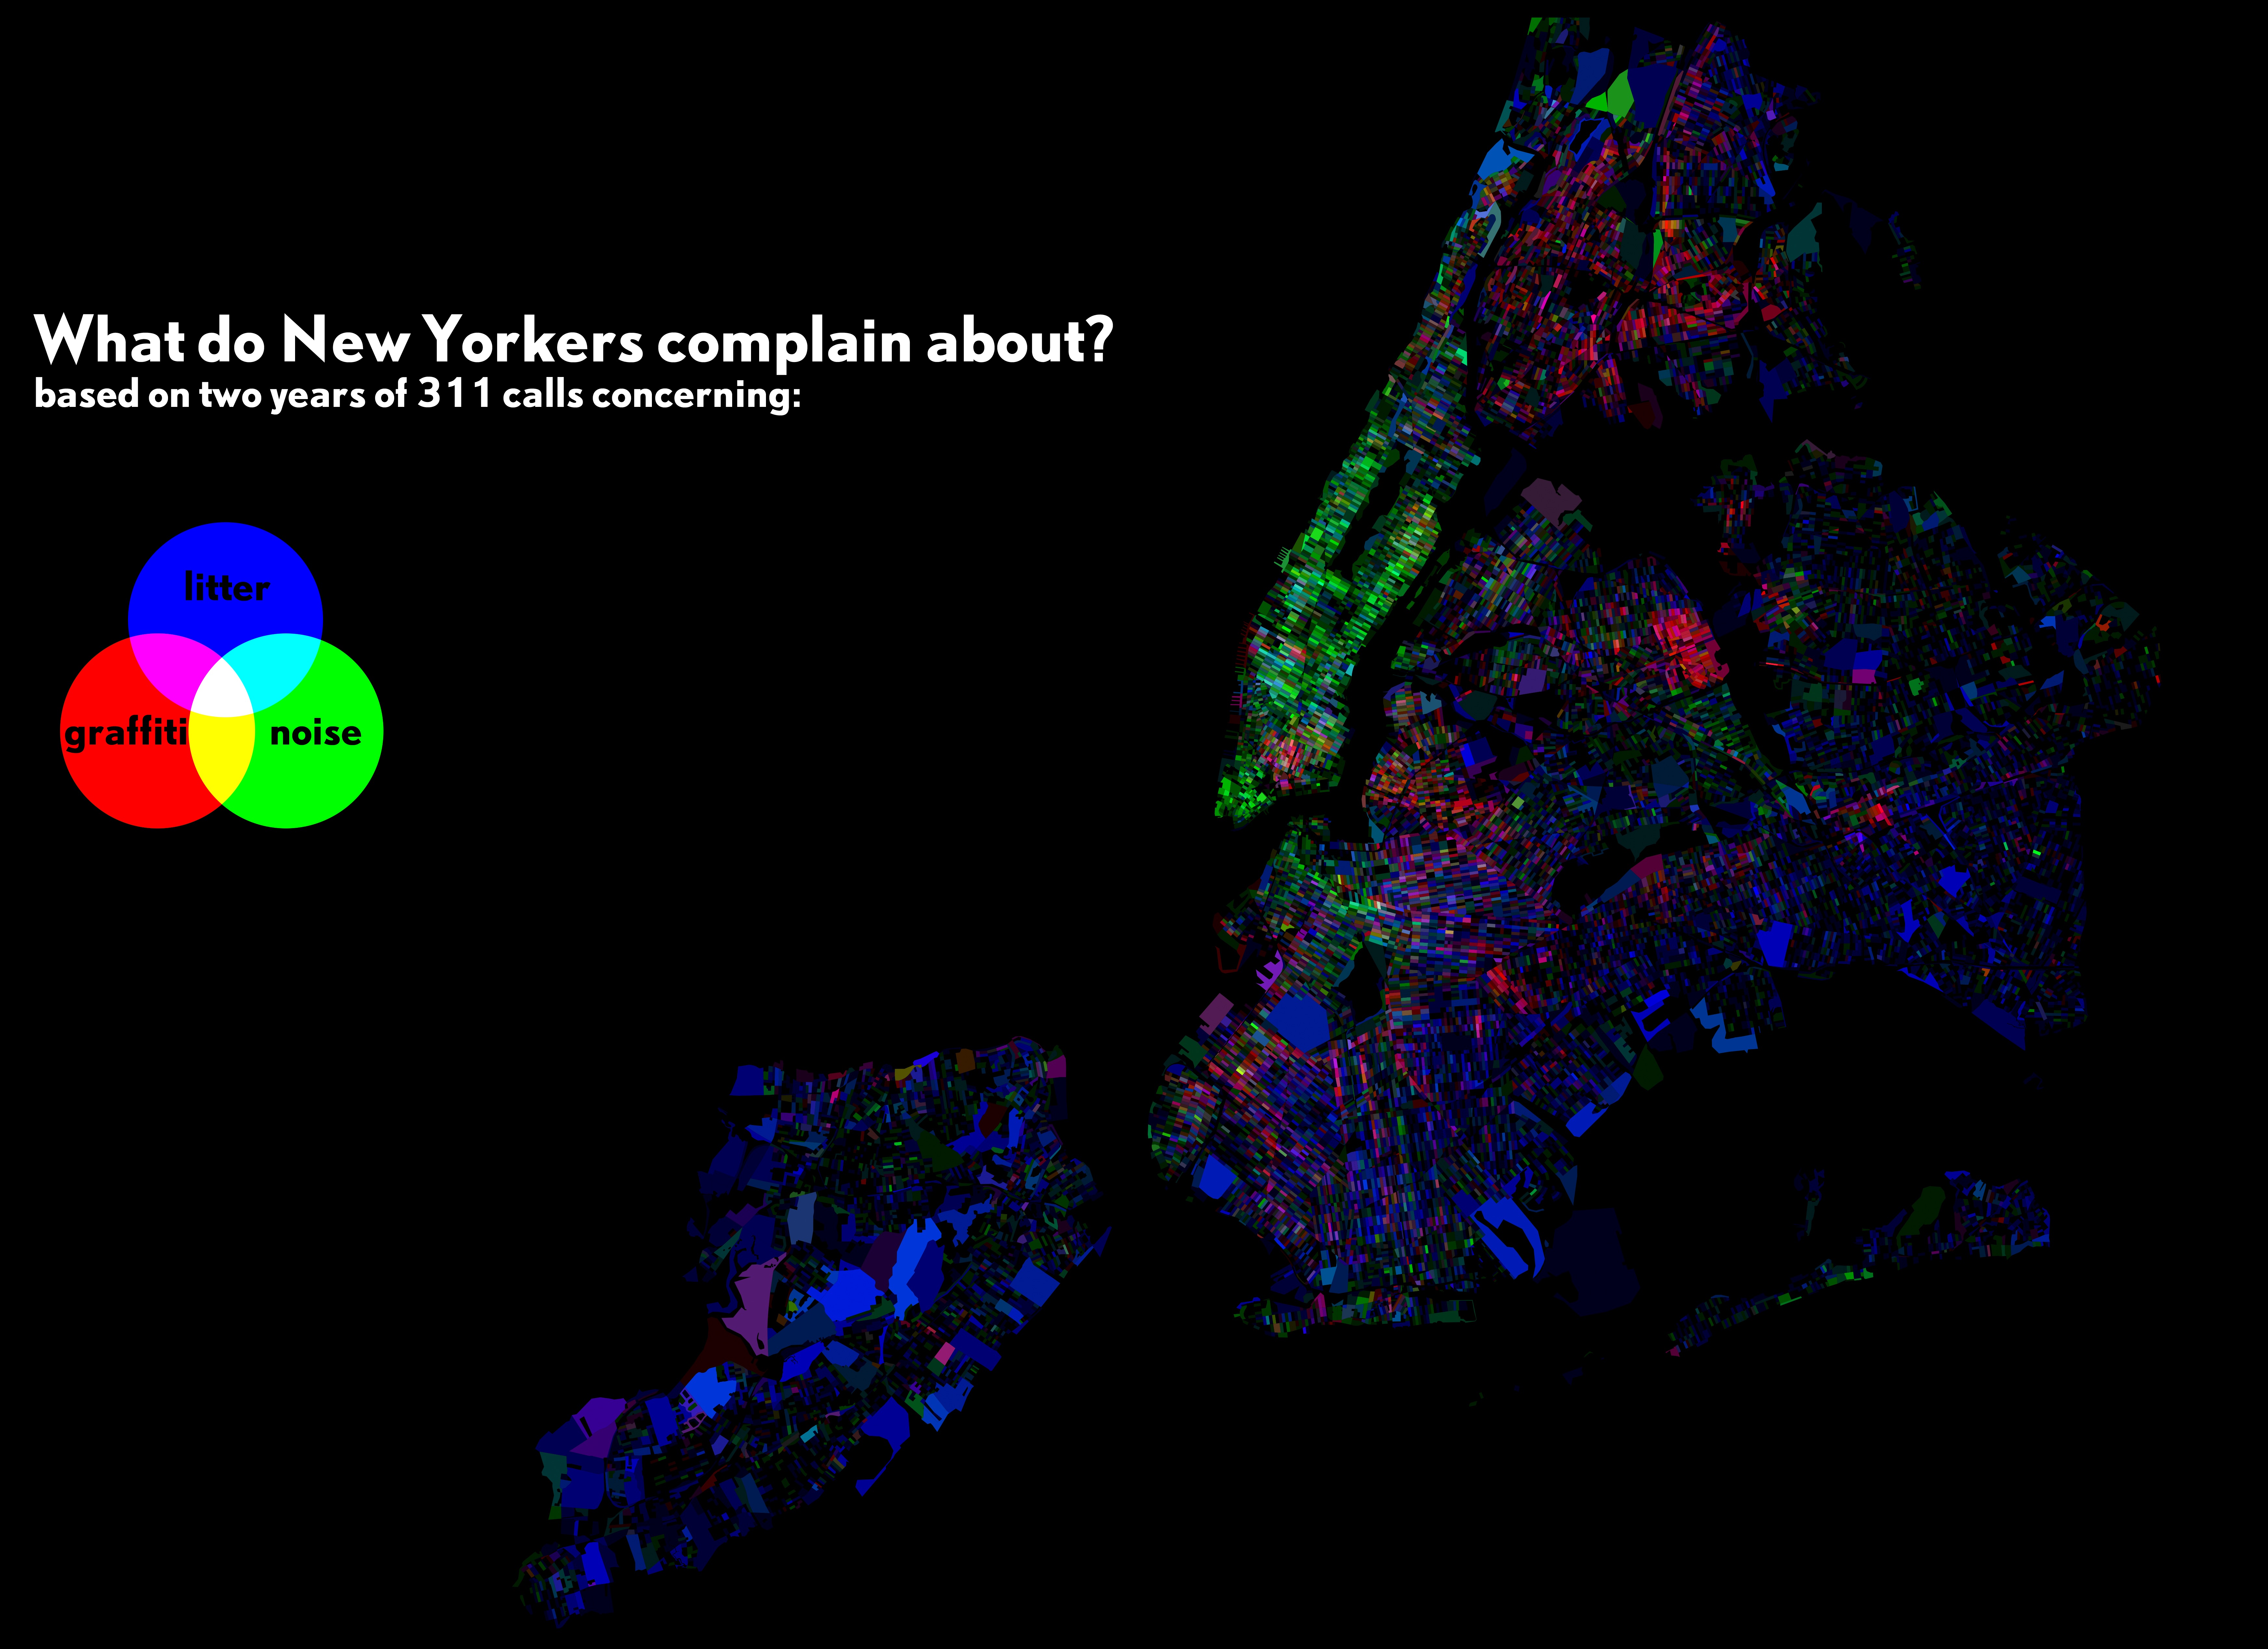
From among the top 15 categories, I selected complaints about noise, litter and graffiti – urban issues that everyone can relate to. They were similar in terms of number of complaints, but very distinct in terms of their spatial patterns.

I used the RGB channels for each respective category, creating a composite that allows a comparison of all three parameters at the same time. Showing more than two parameters is usually very difficult in thematic maps. This strategy creates a surprisingly salient spatial pattern. It seems that Manhattan complains more about noise, the Bronx more about graffiti, and Staten Island more about litter.

The Observer – Shhhh! We’re Gentrifying Here: Mapping the City’s 311 Complaints Oct 4, 2012
The Atlantic Wire – What are New Yorkers complaining about now Oct 5, 2012
Gothamist – New Map Shows Us What New Yorkers Are Bitching About Now Oct 4, 2012
Curbed – A Colorful Kaleidoscope of New Yorkers’ Complaints Oct 4, 2012
Atlantic Cities – Map of the Day: New York’s Geography of Complaining Oct 02, 2012
The City Atlas – Sweet dissatisfaction: using map art to understand NYC’s most common complaints Oct 5, 2012
Animal New York – Beautiful Map of New York City’s 311 Complaints Oct 4, 2012
L Magazine – New Map Shows Neighborhood Gentrification Based On Noise Complaint Frequency Oct 5, 2012
Io9 / Gawker – An interactive map of what New Yorkers complain about, by borough Feb 4, 2013
exp.lore.com Feb 3, 2013
Neatorama – What Do New Yorkers Complain About? Feb 4, 2013

Hosted at Visualizing.org Oct 1, 2012

dust serenade at MIT museum

dust serenade at MIT museum

dust serenade at MIT museum

Our new project in the dust series:

Markus Decker, Dietmar Offenhuber, Orkan Telhan

Dust Serenade‘ is a reenactment of an acoustic experiment done by German physicist August Kundt. Inspired by the Chladni’s famous sand figures visualizing sound waves in solid materials, Kundt devised an experiment for visualizing longitudinal sound waves through fine lycopodium dust; a setup that would allow him to measure the speed of sound in different gases.

Kundt was a strong believer in experimental methods over purely theoretical inquiry in a time when the disciplines of theoretical and experimental physics started to diverge.

‘Dust Serenade’ intends to remind us the materiality of sound. Tubes filled with scraps of words and letters–cut-up theory–interact with sound waves and turn into figures of dust. Here, visitors can modulate the frequency of the sound emitted by moving a rod and create different harmonic sound effects. As sound waves figure, refigure, and disfigure the text, we invite visitors to rethink about the tension between their theorical knowlegde and the sensory experience.

Dust Serenade is one of a series of interactive sound projects that enable visitors to experience the physical aspects of sound, presence, and atmosphere. Works in the series have been shown at the Ars Electronica Festival in Linz, Zagreb, Istanbul and São Paulo.

The project was funded by the Council for the Arts at MIT and the Austrian Federal Ministry for Education, Arts and Culture (BMUKK)

Mapping the Archive

Mapping the Archive

Mapping the Archive

Evelyn Münster, Jaume Nualart, Dietmar Offenhuber, Moritz Stefaner, Gerhard Dirmoser

This project presents the results of an interdisciplinary investigation of the Prix Ars Electronica archive in the form of interactive and static visualizations of information. The archive is examined on three levels: total submissions since 1987 as a quantitative analysis, the jury process as a social network analysis, and the winning projects and their context in accordance with art scholarship.

The project is a collaboration between the Ludwig Boltzmann Institute Media.Art.Research. and Ars Electronica. More on our visualization showcase website.

News: The project was featured on infosthetics.com, thanks Mahir!

A Timeline of Audiovisual Culture

A Timeline of Audiovisual Culture

A Timeline of Audiovisual Culture

Related to the See this Sound exhibition, The Ludwig Boltzmann Institute created on an encyclopedia of audiovisual culture during the last three years. As a installation in the exhibition, Stefan Schilcher and I created an interactive visualization showing the structural properties of the different texts, chapters in this encyclopedia.
Credits:
Visual Concept: Dietmar Offenhuber und Stefan Schilcher
Programming: Stefan Schilcher
Content: Sandra Naumann und Mario Röhrle

more on the blog of see this sound.