What we talk about when we talk about data physicality

What we talk about when we talk about data physicality

What we talk about when we talk about data physicality

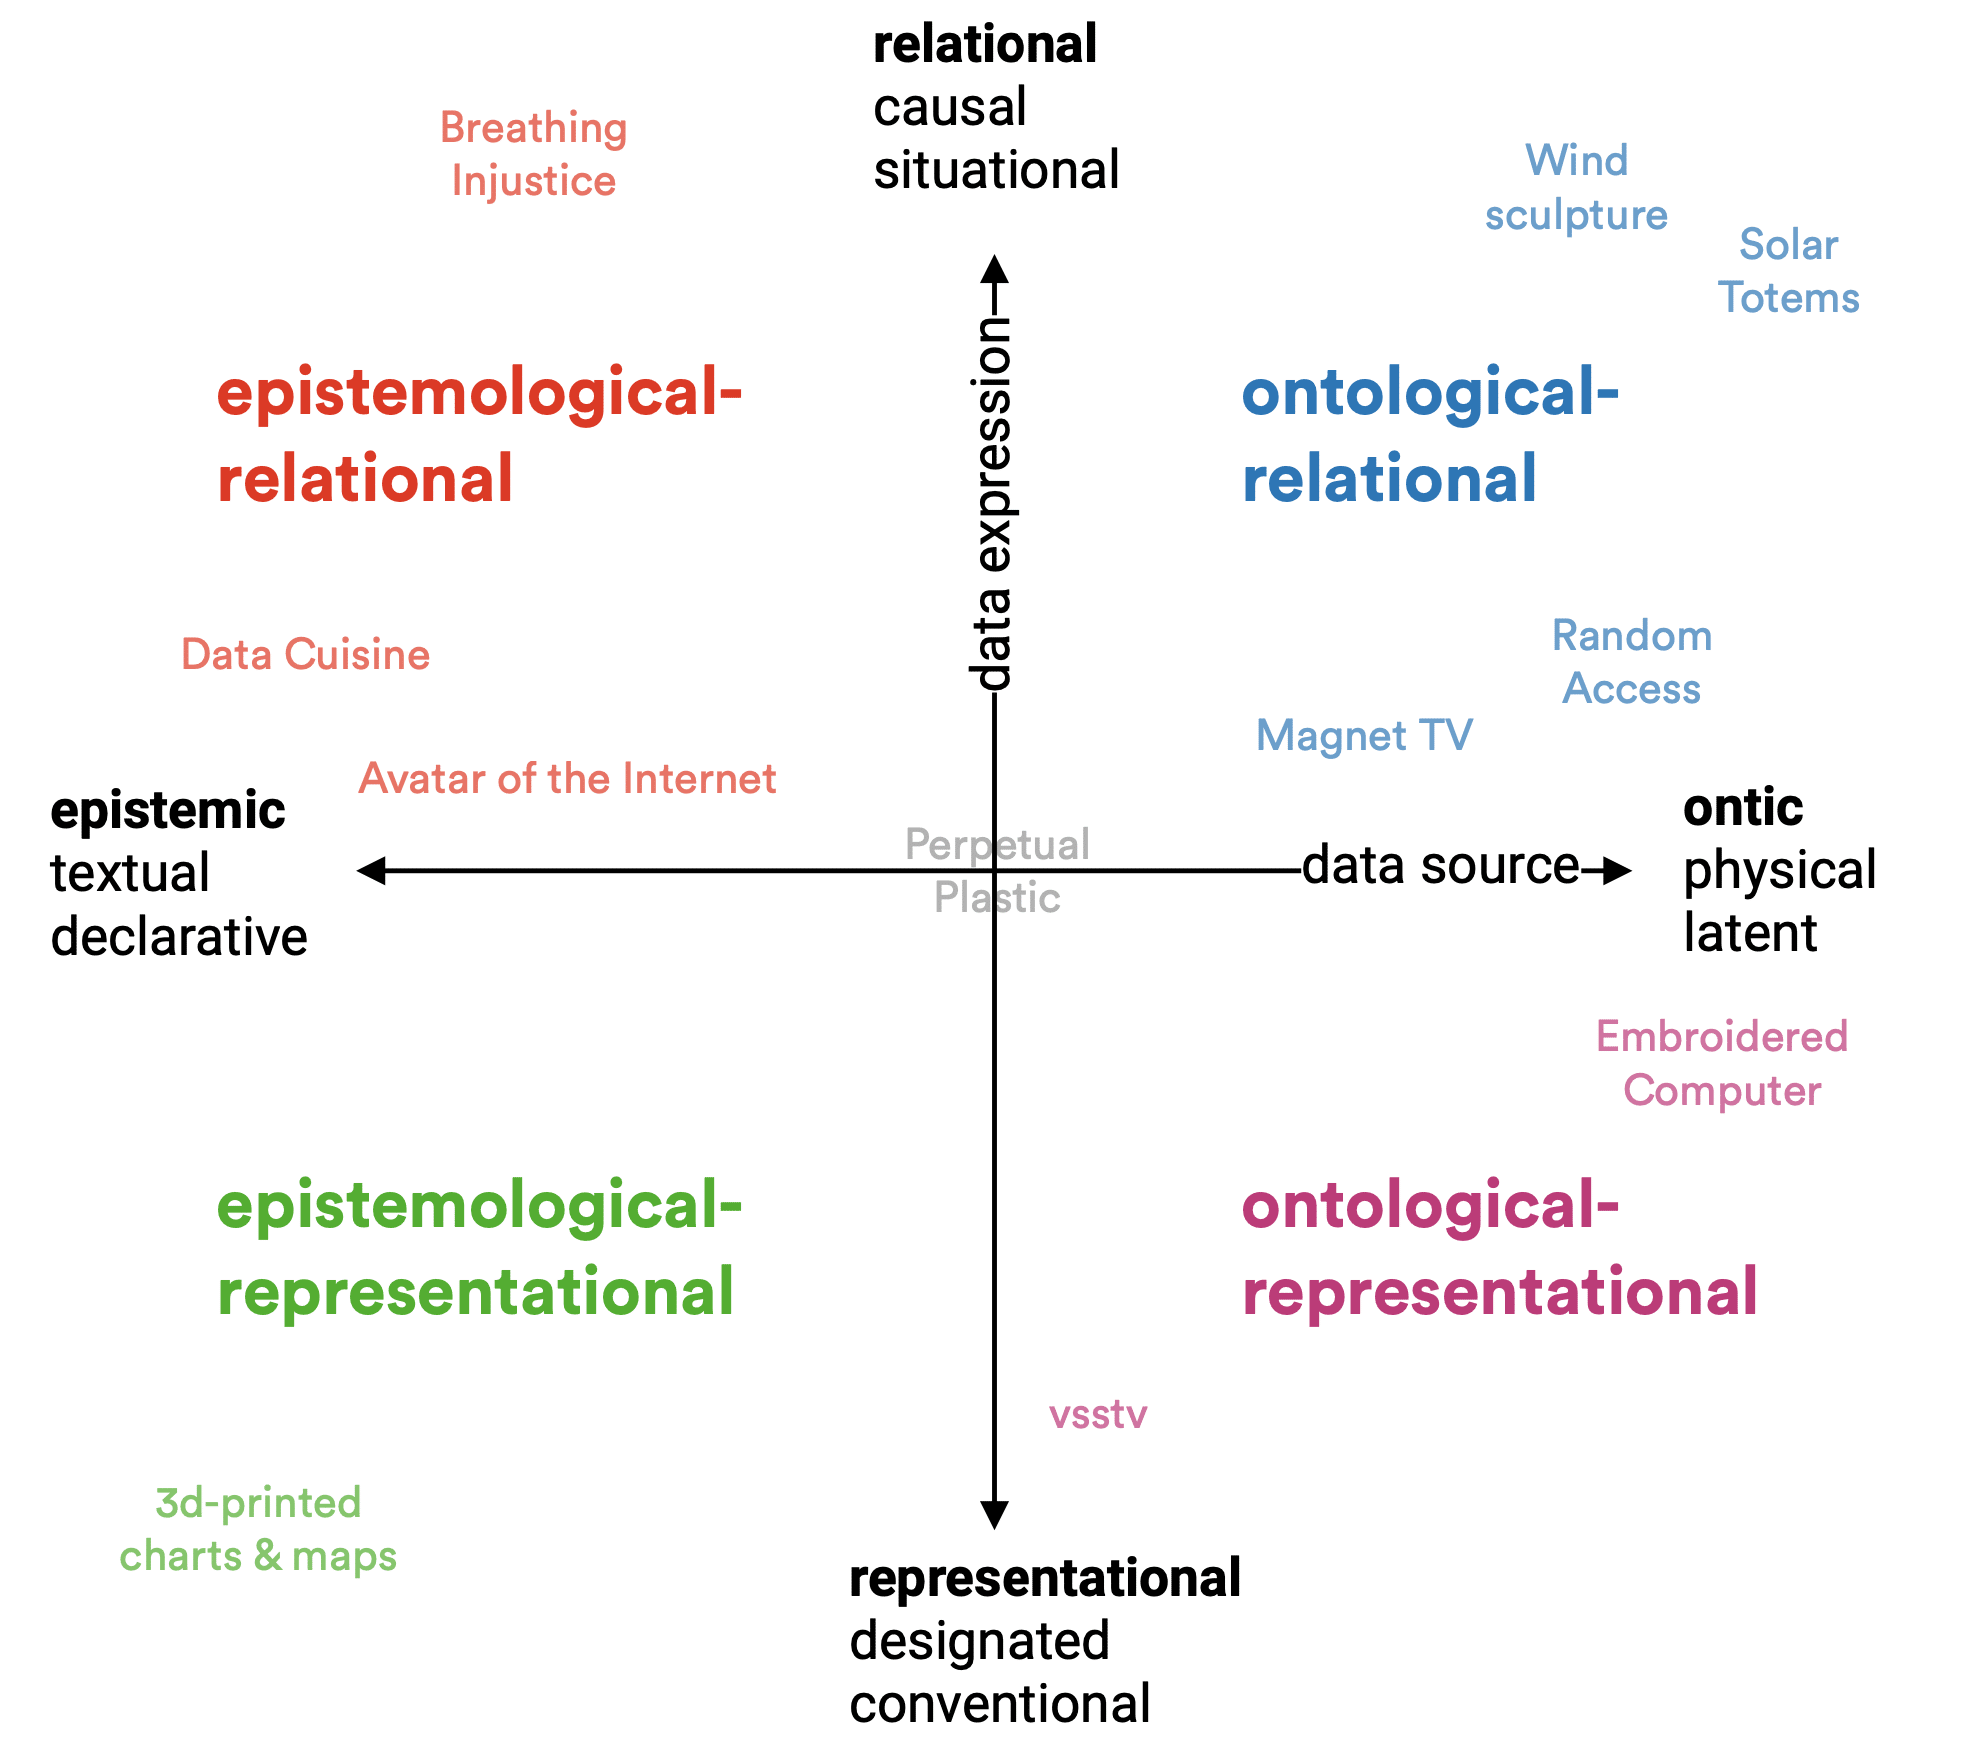
For the IEEE Computer Graphics & Applications journal upcoming special isssue on data physicalization, I wrote a paper on data materiality, especially focused on which concepts of data are mobilized in the data physicalization discourse and practice. 

Data physicalizations “map data to physical form,” yet many canonical examples are not based on data sets. To address this contradiction, I argue that the practice of physicalization forces us to rethink traditional notions of data. This paper proposes a conceptual framework to examine how physicalizations relate to data. This paper develops a two-dimensional conceptual space for comparing different perspectives on data used in physicalization, drawing from design theory and critical data studies literature. One axis distinguishes between epistemological and ontological perspectives, focusing on the relationship between data and the mind. The second axis distinguishes how data relate to the world, differentiating between representational and relational perspectives. To clarify the aesthetic and conceptual implications of these different perspectives, the paper discusses examples of data physicalization for each quadrant of the continuous space. It further uses the framework to examine the explicit and implicit assumptions about data in physicalization literature. As a theoretical paper, it encourages practitioners to think about how data relate to the manifestations and the phenomena they try to capture. It invites exploration of the relationship between data and the world as a generative source of creative tension.

The paper can currently be accessed as a pre-print on the arxiv server 

The Inscriptome: virus as a visual instrument

The Inscriptome: virus as a visual instrument

The Inscriptome: virus as a visual instrument

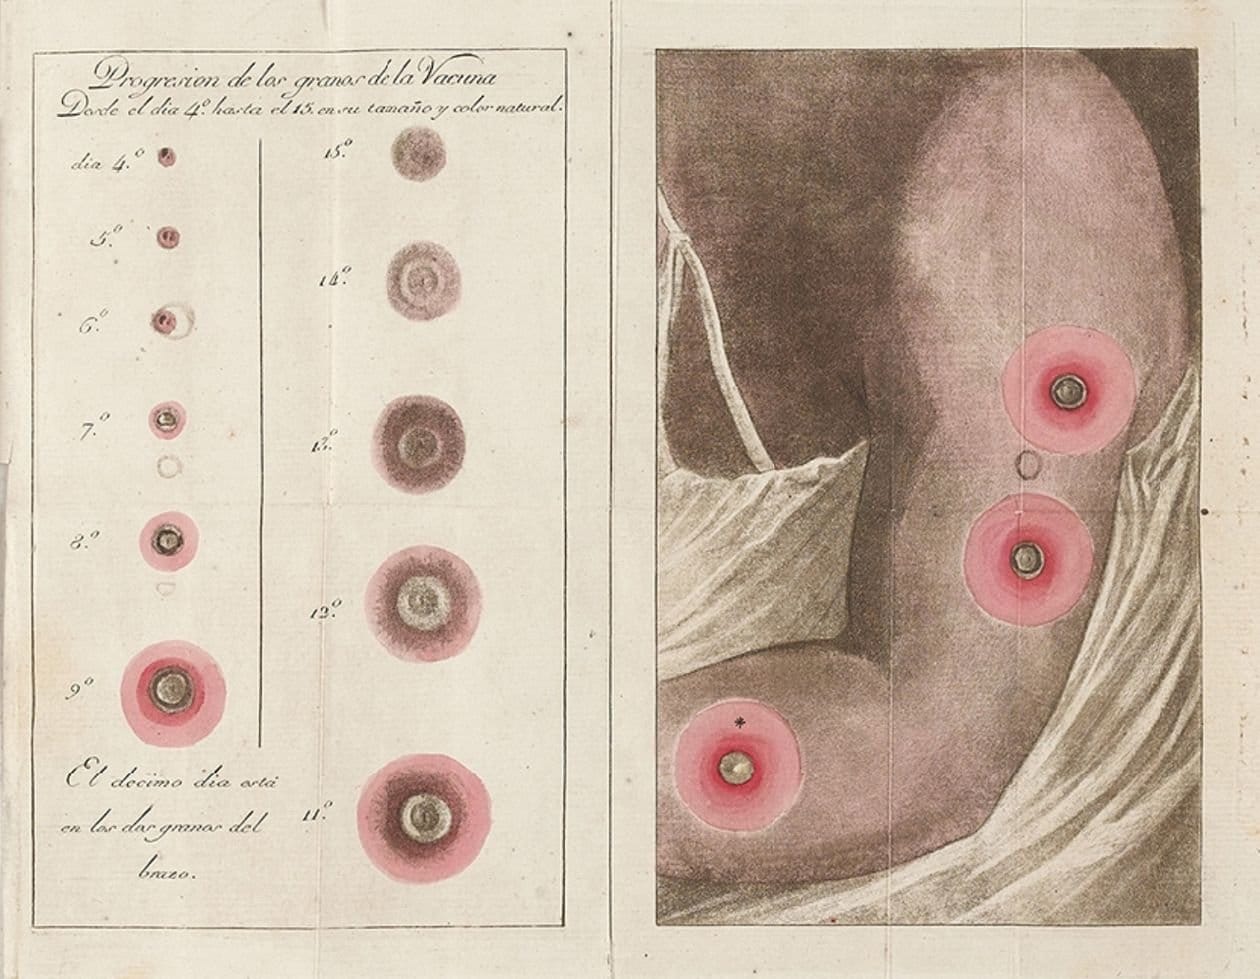
In this piece for the Strelka Magazine, Orkan Telhan and I looked at the cultural and historical context of viruses and their vaccines as media of inscription. Based on the model of 19th century arm-to-arm vaccination, we look at how the governance of viral inscriptions is a delicate balancing act.

The virus inscribes itself onto the body, but how does it inscribe itself onto the city and the world at large? A new inscription system based on material proxies, bioindicators, and metagenomic signatures allows us to see viruses as recording agents and better understand which spaces they conquer, which species they traverse, and what can stop them.

Link to the piece

Image: Color plate by Francisco Javier de Balmis shows smallpox vaccination scars. Courtesy of Welcome Library

Autographic Visualization (IEEE VIS Paper)

Autographic Visualization (IEEE VIS Paper)

Autographic Visualization (IEEE VIS Paper)

Data by Proxy — Material Traces as Autographic Visualizations

Per definition, data visualization can only begin when data exists. As a result, the process of data collection remains mostly hidden. Visualization methods are designed to reveal patterns in data; however, many public controversies are not about what is “in” the data, but about the circumstances of data collection.

Autographic visualization is a speculative counter-model to data visualization based on the premise that data are something material rather than something abstract and symbolic. The design operations of autographic visualization aim to set the conditions that allow material phenomena to reveal themselves — as physical traces or environmental indicators. The design of autographic or self-registering devices has a long history that is closely connected to the history of data visualization. Today, autographic visualization can be used to make the process of data collection more legible and accountable. The comparison between the two models allows probing the epistemic assumptions behind information visualization and uncovers linkages with the rich history of scientific visualization and trace reading.

link to IEEE VIS paper
VISAP pictorial

Paper: Maps of Daesh

Paper: Maps of Daesh

Paper: Maps of Daesh

The Cartographic Warfare Surrounding Insurgent Statehood 

The ongoing Syrian civil war raises new cartographic challenges, including the ethical question of how the self-proclaimed Islamic State should be represented. States and news organizations face a conundrum: by mapping IS territory, they implicitly acknowledge its statehood. I investigate how different mapping methods carry different connotations for representing the strength and nature of the terror state, arguing that the statehood the IS is symbolically contested through cartographic choices that reflect the diverging interests of map makers.

Based on a comparative study, this article investigates the visual languages of IS sanctuary maps as published by news agencies, intelligence agencies, or circulated by the insurgents themselves. I argue that the statehood of territory held by the IS is symbolically contested through cartographic choices that reflect the diverging interests of the map makers. Beyond official representations, the article also considers the maps created by amateur conflict mappers and visual forensics experts, who extract and cross-reference information from social media including posted cell phone and drone footage, georeferenced tweets, and satellite images. I argue that the novel visual strategies developed by these practitioners for presenting visual evidence emphasize nonrepresentational aspects of cartography and represent a countermodel to established cartographic languages that follows an indexical rather than iconic or symbolic paradigm. 

Link    Pdf      Link to the Map Archive 

Pdf with original figures from the paper 

Tracings of original images by Azam Majooni