Infrastructure legibility
Infrastructure legibility
Offenhuber, D. 2014. “Infrastructure Legibility–a Comparative Analysis of open311-Based Citizen Feedback Systems.” Cambridge Journal of Regions, Economy and Society, March.
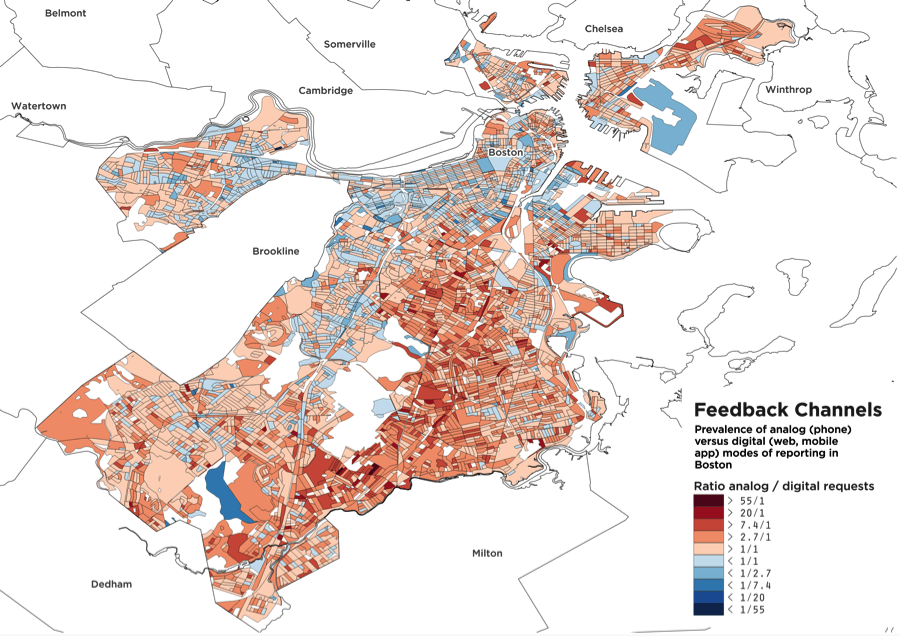
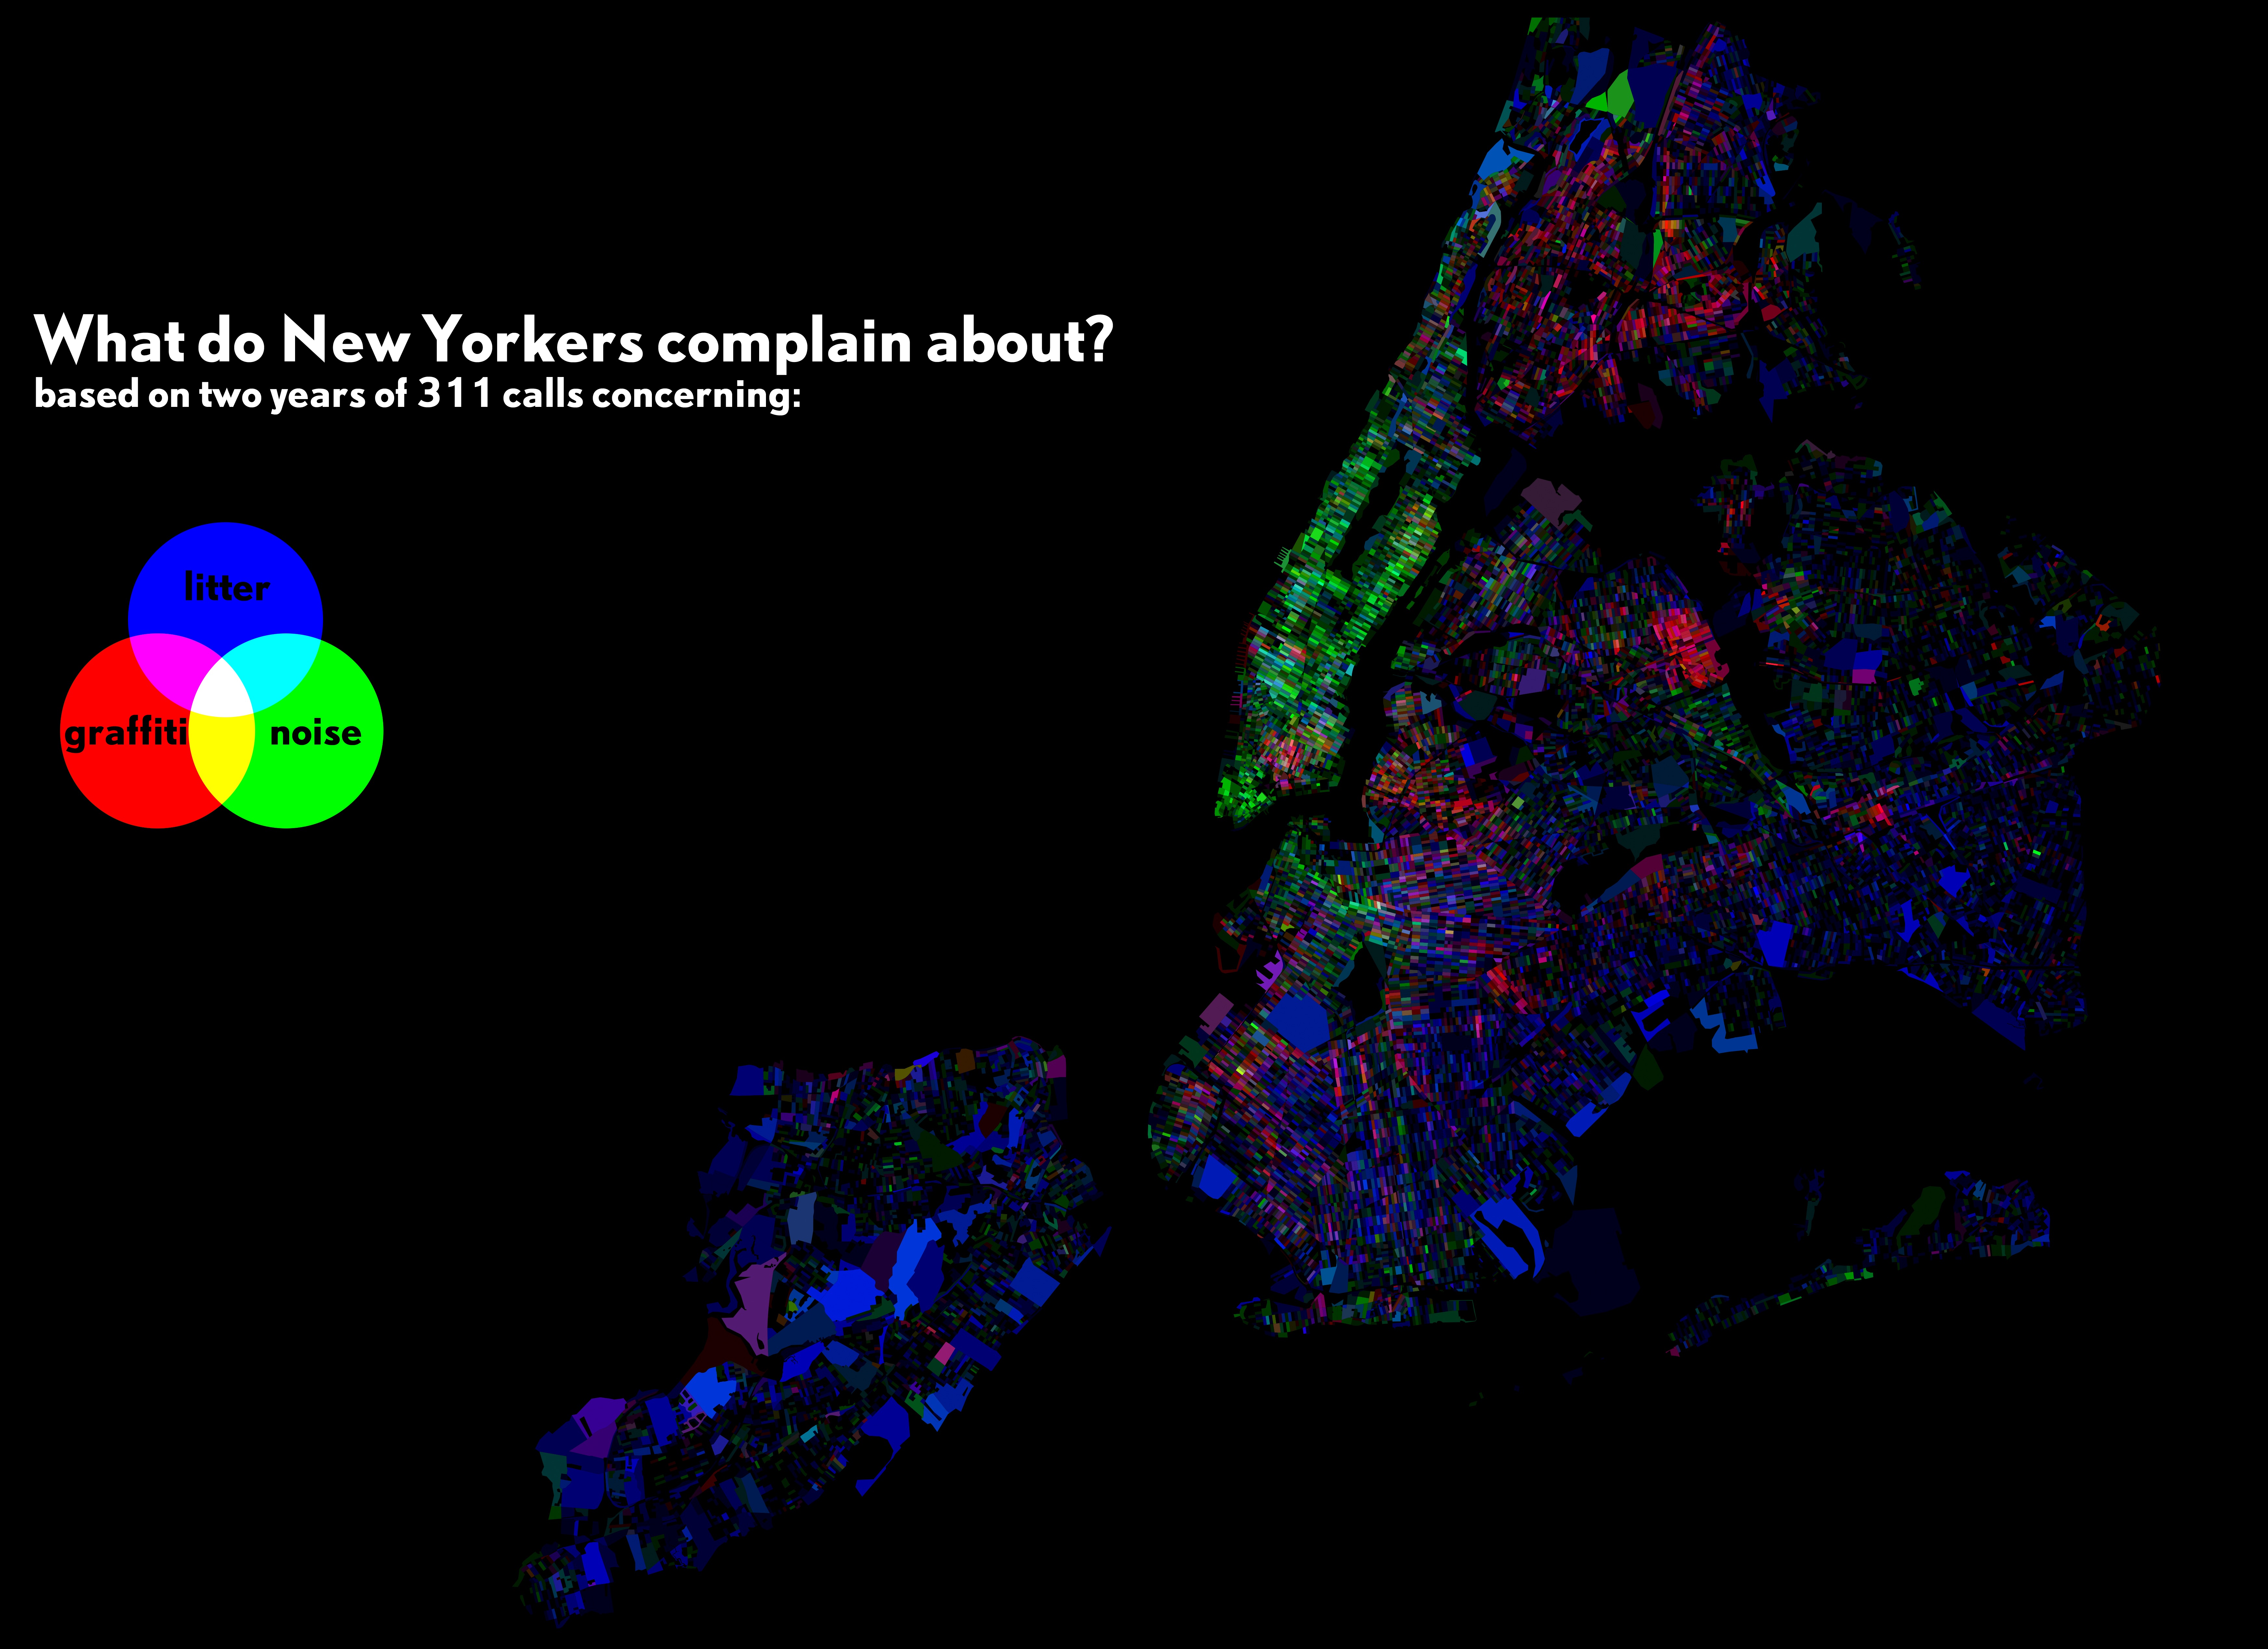
During the past decade, most large US cities have implemented non-emergency incident reporting systems via telephone helplines, websites and more recently, mobile applications. Using data from systems operating in the larger Boston area, and spatial and grounded theory analysis of submitted reports, this article investigates the role of design in shaping the interaction between the citizens and the city. It investigates the following questions: Which assumptions about the users are embedded in design of existing feedback systems? What motivates users to participate, and how do the systems’ design choices correspond with these motivations? By what mechanisms do these systems facilitate and constrain the interaction between citizen and city? (From the abstract)
The results show that subtle differences in the design of the system have an impact on the way conversations are led over the system and arguments are framed. The prescription of feedback categories, the management of visibility and persistence of reports, and the degree of other user’s social presence are important elements that contribute to the way governance of public infrastructure is enacted.